
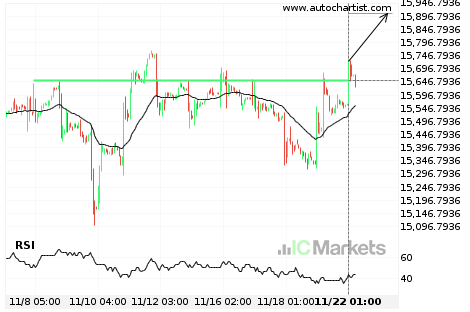
Possible start of a bullish trend on FTSE China A50 Index
FTSE China A50 Index has broken through a line of 15650.6396. If this breakout holds true, we could see the price of FTSE China A50 Index heading towards 15906.5029 within the next 2 days. But don’t be so quick to trade, it has tested this line numerous times in the past, so you should probably […]
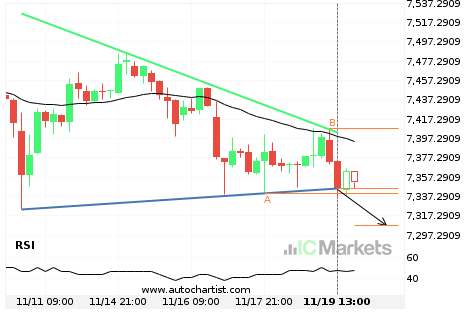
Australia 200 Index – support line breached
Australia 200 Index has broken through the support line of a Triangle technical chart pattern. Because we have seen it retrace from this line in the past, one should wait for confirmation of the breakout before taking any action. It has touched this line twice in the last 9 days and suggests a possible target […]
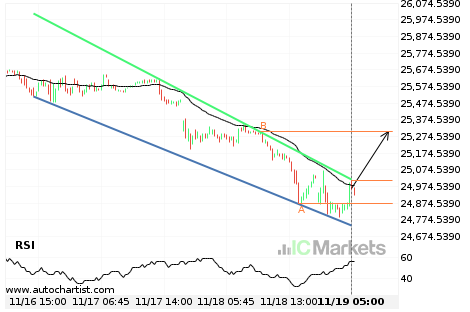
Hong Kong 50 Index – getting close to resistance of a Channel Down
Hong Kong 50 Index is moving towards a resistance line. Because we have seen it retrace from this line before, we could see either a break through this line, or a rebound back to current levels. It has touched this line numerous times in the last 3 days and may test it again within the […]
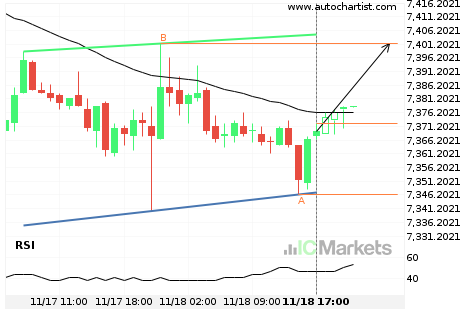
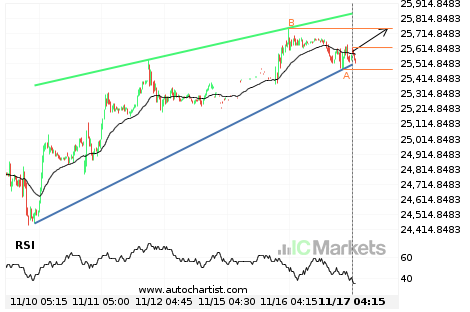
Should we expect a breakout or a rebound on Australia 200 Index?
The movement of Australia 200 Index towards the resistance line of a Channel Up is yet another test of the line it reached numerous times in the past. This line test could happen in the next 7 hours, but it is uncertain whether it will result in a breakout through this line, or simply rebound […]

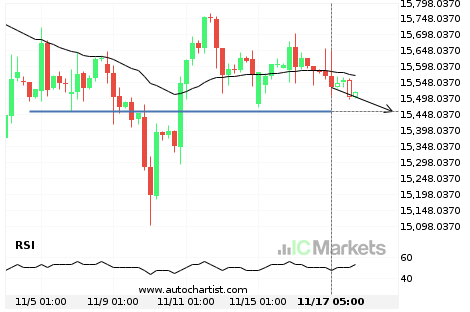
FTSE China A50 Index approaching important 15459.0703 price line
FTSE China A50 Index is approaching the support line of a Support. It has touched this line numerous times in the last 13 days. If it tests this line again, it could do so in the next 2 days.
FTSE China A50 Index approaching important 15459.0703 price line
FTSE China A50 Index is approaching the support line of a Support. It has touched this line numerous times in the last 13 days. If it tests this line again, it could do so in the next 2 days.
Hong Kong 50 Index – getting close to resistance of a Rising Wedge
Hong Kong 50 Index is moving towards a resistance line. Because we have seen it retrace from this line before, we could see either a break through this line, or a rebound back to current levels. It has touched this line numerous times in the last 8 days and may test it again within the […]
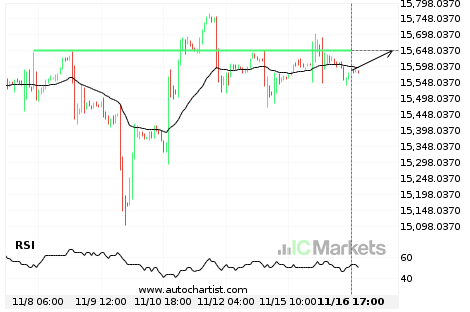
FTSE China A50 Index approaching important 15650.6396 price line
FTSE China A50 Index is approaching the resistance line of a Resistance. It has touched this line numerous times in the last 9 days. If it tests this line again, it could do so in the next 2 days.

FTSE China A50 Index approaching important 15650.6396 price line
FTSE China A50 Index is approaching the resistance line of a Resistance. It has touched this line numerous times in the last 9 days. If it tests this line again, it could do so in the next 2 days.